")
Are you tired of your WordPress website running slowly and losing visitors due to poor performance? A performance audit can help you identify these issues’ root causes and provide actionable steps to improve your site’s speed and overall performance.
A WordPress performance audit involves analyzing various aspects of your site, such as its code, content, and hosting environment, to identify areas that may be causing it to run slowly or inefficiently. It also gives you insights into what steps you can take for better performance.
In this blog post, I will walk you through the process of conducting a WordPress performance audit, including what to look for, what tools to use, and how to interpret the results. So, if you’re ready to take your WordPress site to the next level, read on!
What Is a WordPress Performance Audit?
A WordPress website audit is like a thorough checkup for a website to see how fast it loads and how much it uses computer resources. For example, imagine you have a WordPress site that takes a long time to show up when someone visits it.
A performance audit would dig into the reasons behind this slowness. It might be that the images on your site are too big and need to be resized or that there are unnecessary plugins installed that are making things slow.
By doing this audit, you can identify and fix these issues, making your website faster and giving your visitors a better experience. This kind of checkup can also be a helpful list when making a new website, ensuring all the important stuff is done well from the beginning.
Why Is a WordPress Performance Audit Important?
Maintaining the value of your website, both for you and your visitors, relies on its continuous functionality and optimization. Regularly auditing your WordPress site is a crucial step in achieving this.
WordPress websites have different parts, like themes and plugins. Just like any other software, your WordPress site can have problems over time. Checking it helps to fix these problems before they get big.
Also, when you audit your site, you can see how good it is for marketing. You can check how fast it loads if it appears in search engines, where you put forms, and more. So overall, auditing your site has two main advantages.
First, maintaining its value and functionality benefits you as the website owner. Second, it has a positive impact on user experience and search engine optimization (SEO), helping your site to be easily found and used by visitors.
Compare So Called “Best Hosting Providers” & Make the Switch to Cloudways!
Discover how others compare to Cloudways’ ultra-fast servers and find the right hosting for yourself.
How to Conduct a WordPress Performance Audit?
We can divide our WordPress website performance audit into three parts:
- Front-End Website Performance Audit (With Tools)
- Front-End Website Performance Audit (Manually)
- Back-End WordPress Performance Audit
Front-End Website Performance Audit (With Tools)
Within the front-end performance audit, we can perform a synthetic audit where we rely on tools and then a manual audit where we do everything by ourselves. Let’s start with the synthetic WordPress performance audit since it is easier.
1. Use Chrome DevTools
When conducting a WordPress website audit, you can use the Google Chrome Developer Tools, which include many useful options to check and evaluate a website. These tools are available by default in your Chrome browser.
You can launch the Chrome DevTools simply by clicking the F12 key or Ctrl+Shift+I. Some of the important tabs to check out to improve WordPress performance include:
- Network
- Performance
- Performance Insights
- Lighthouse
1. Network
The Network Monitor provides a close-up look at all your browser’s requests, the responses it gets, and the time it takes for each step. We’d look at the Network tab in more detail in this blog’s Manual performance audit section.
2. Performance
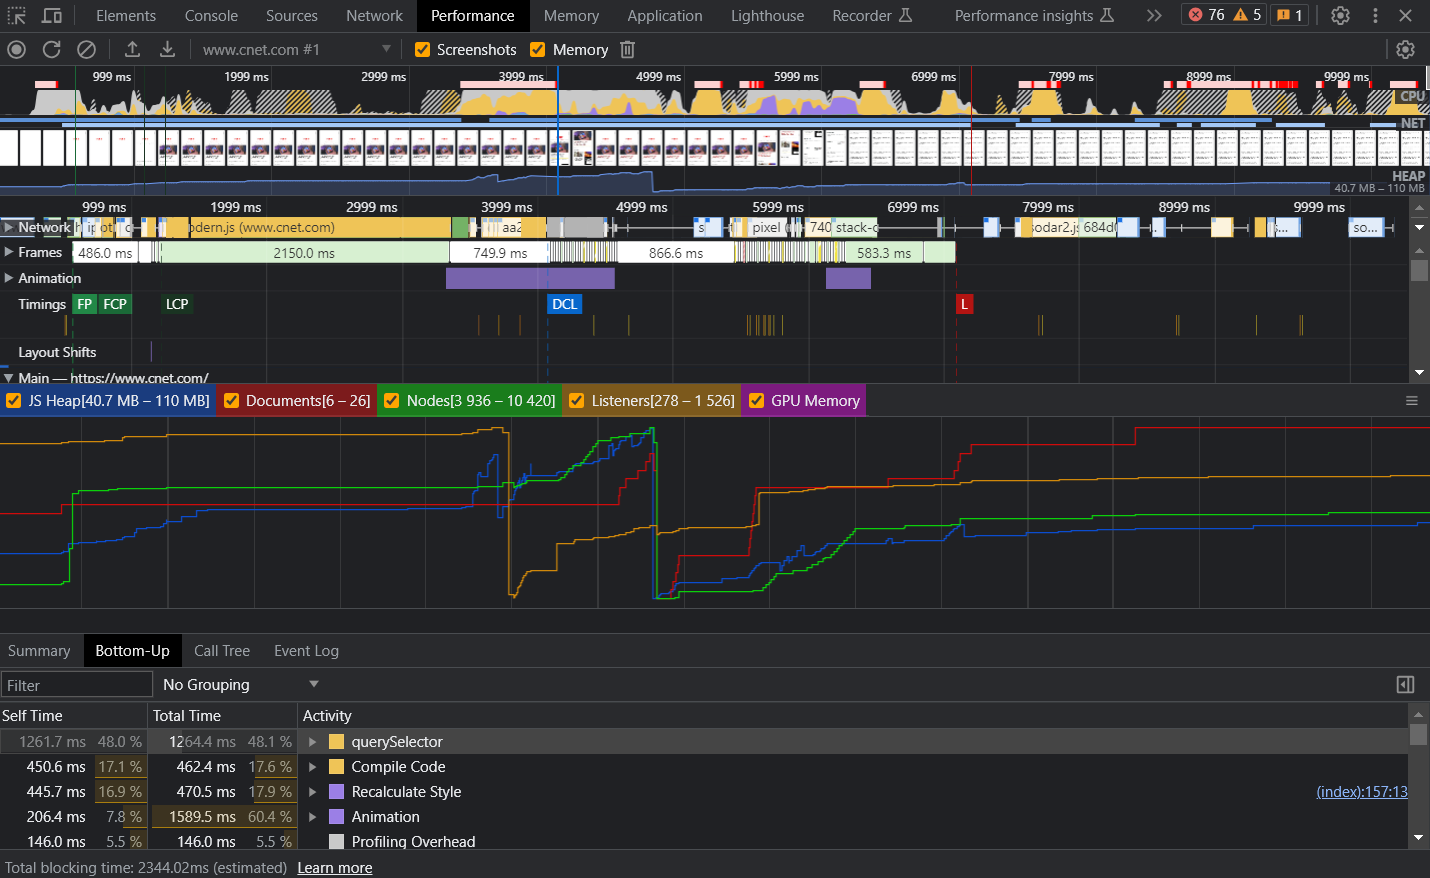
Chrome DevTools’ Performance tab lets you analyze how a website loads and renders. It simulates user interaction to provide metrics and insights about the page load process.
This tool is particularly valuable for understanding the main thread. By examining call stacks, you can identify functions causing delays and affecting Time To Interactive.
The ability to access function details and durations helps spot performance issues. If you find long-running functions that block the main thread, consider moving them to worker threads to improve performance.
3. Performance Insights
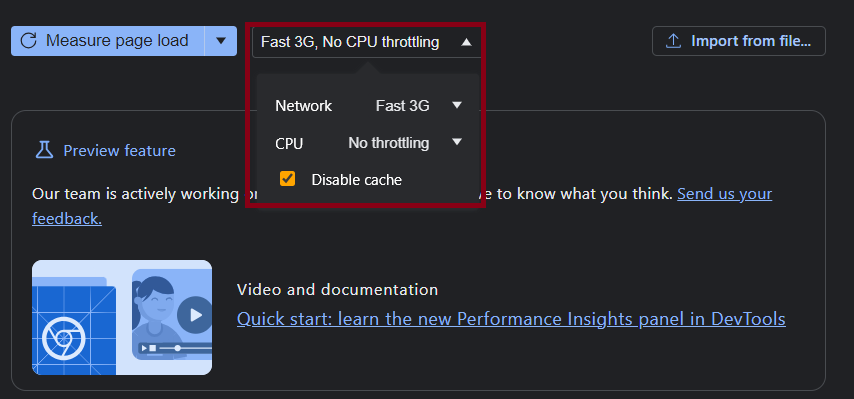
Like the Performance tab, the Performance Insights Tab in Chrome DevTools lets you evaluate website loading. It mimics user interaction for real-world testing. It shows a detailed waterfall view of requests, identifying slow elements and blocking functions.
It offers key metrics like DOM Content Loaded, First Contentful Paint, Largest Contentful Paint, and Time To Interactive. It also simulates network/CPU limits and caching. It helps enhance WordPress performance.
4. Lighthouse
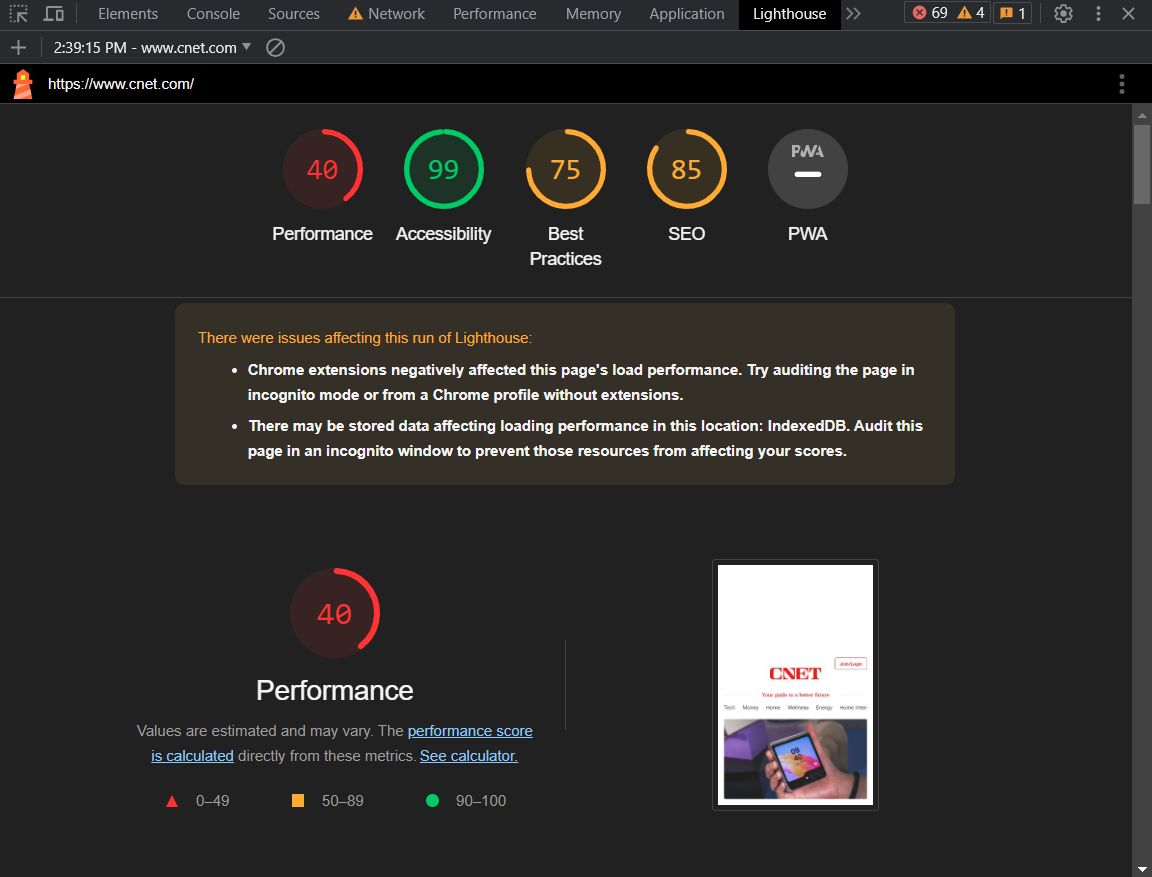
Lighthouse creates reports about how well a website works and is organized. These reports help developers make the website perform better. For auditing, you can use the Lighthouse tool and evaluate the site on these categories:
- Performance
- Accessibility
- Best Practices
- SEO
- Progressive Web App
2. Check Your WordPress Site’s Speed
We’ve all been there – waiting impatiently for a website to load finally.
And when web pages take a long time to load, they mess up how users experience the site and can even reduce the chances of people taking action on your important landing pages.
This is where page speed test tools come in!
1. Google PageSpeed Insights
Google offers a tool called PageSpeed Insights that looks at how fast a page loads and how it behaves on mobile and desktop. It further provides you scores for Core Web Vitals. Depending on what it finds, it gives you practical advice on improving things.
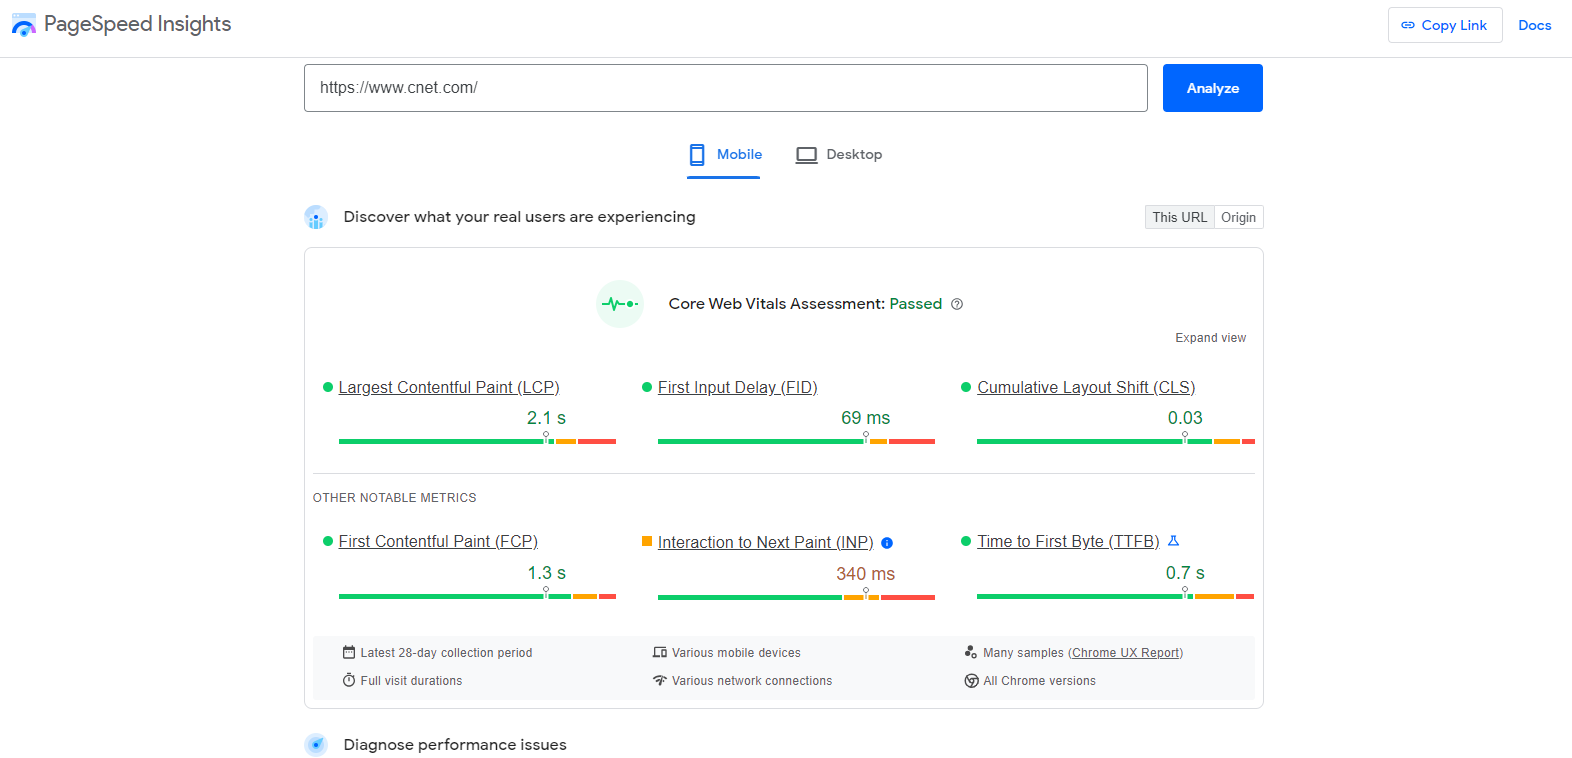
But this isn’t the only tool to help you learn about your site’s speed.
2. GTmetrix
You can also use GTmetrix, which serves the same purpose — helping you analyze and fix your page speed issues.
GTmetrix is a free tool that produces a web performance audit report, offering insights into your GTmetrix Grade and Web Vitals. The visual representation of the loading speed offers a helpful view of how your website appears while it’s loading, combined with the metrics displayed on top of it.
Towards the bottom, the report highlights the main issues, categorized by different aspects: First Contentful Paint, Largest Contentful Paint, Total Blocking Time, and Cumulative Layout Shift.
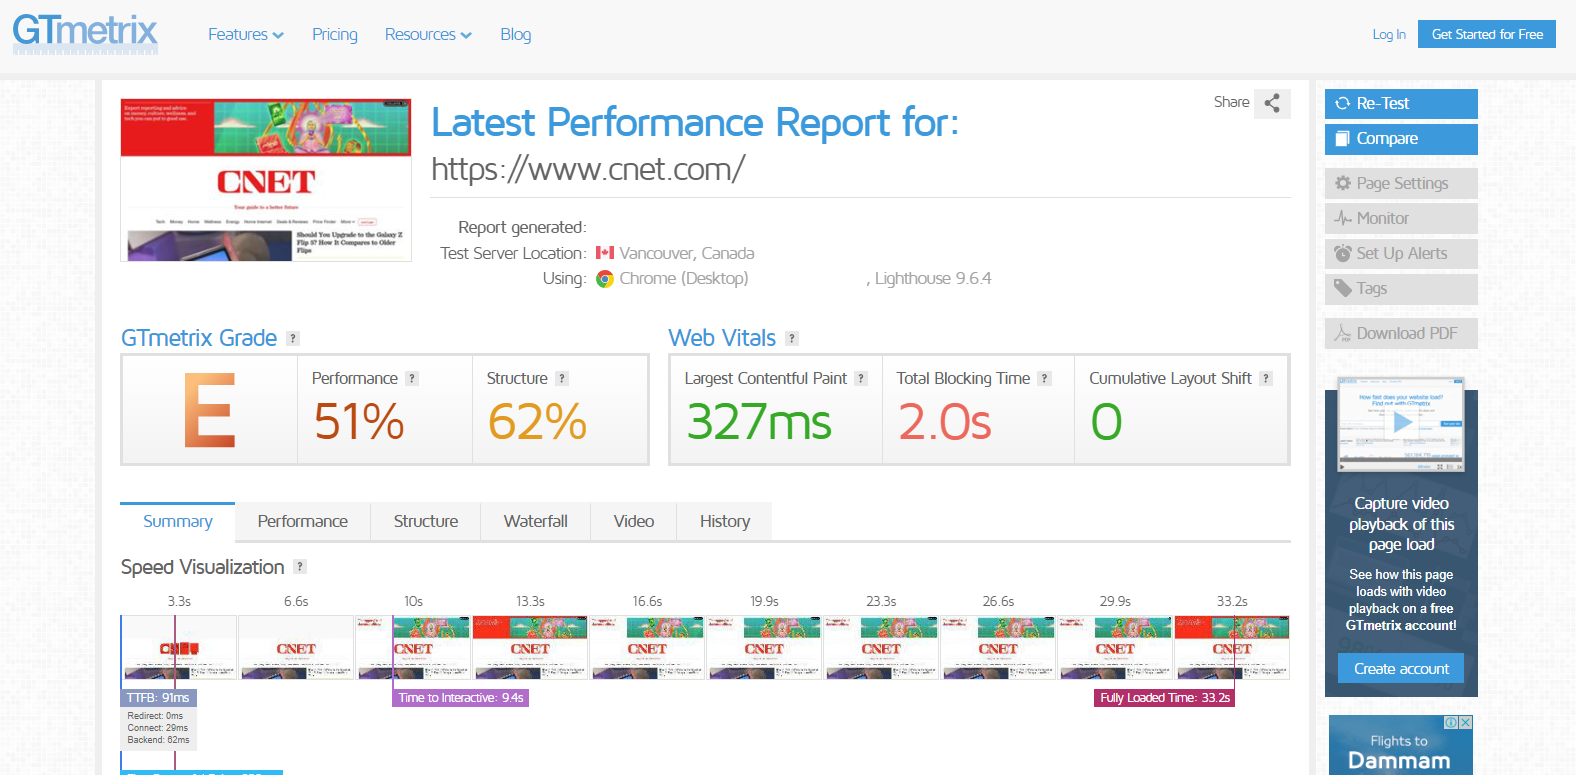
If you look at the screenshot above, you can see that the overall score is E. Websites that want to deliver the best performance should aim for an A.
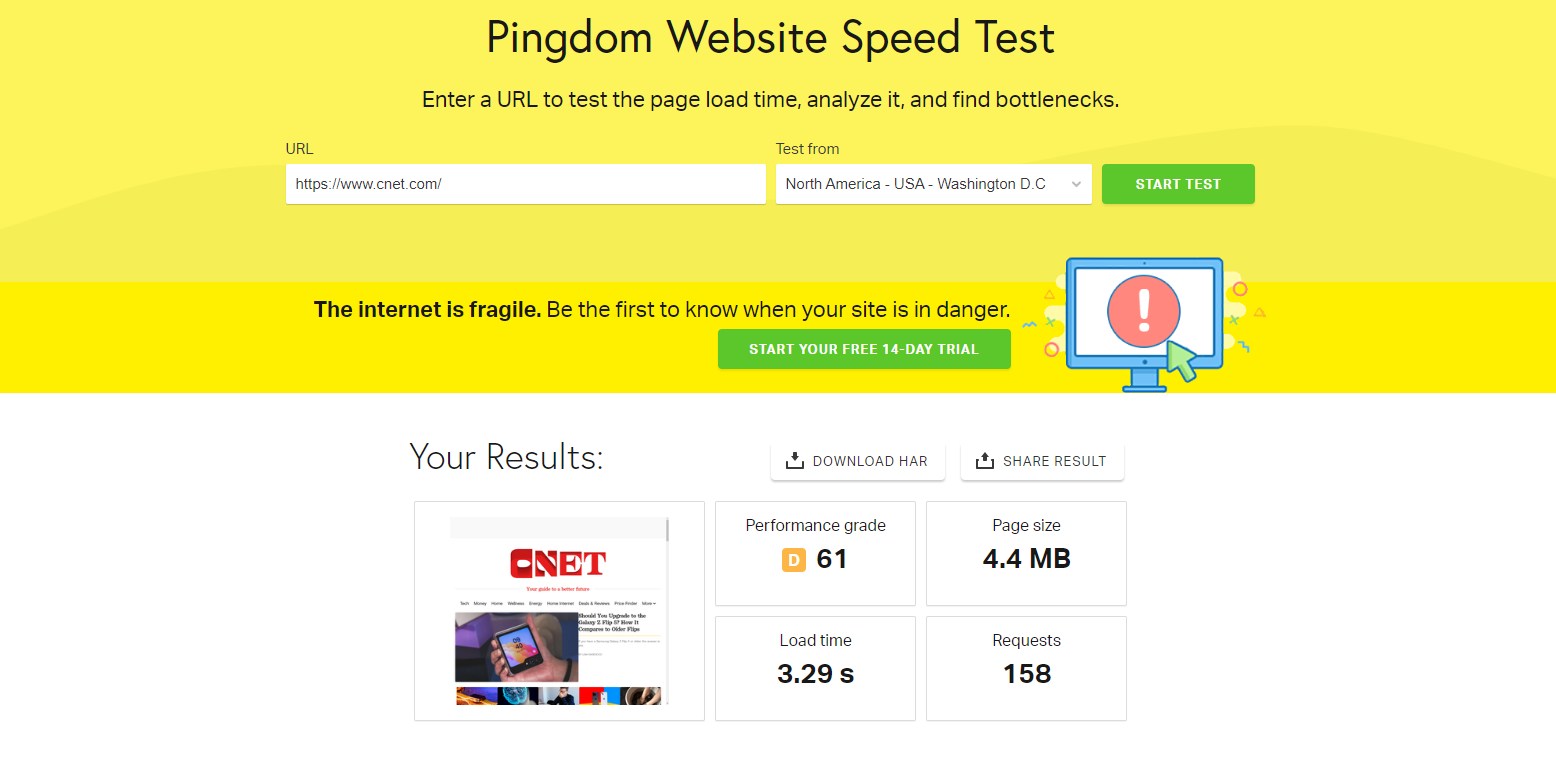
3. Pingdom
Pingdom is another free tool that offers less detailed reports than Google PageSpeed Insights and doesn’t require you to sign in.
It assigns a performance grade ranging from 0 to 100 to your site. Then, it breaks down the requests categorized by domain, content size, types of requests, and response codes and includes a waterfall chart that offers insights into the loading times of your files.
In our test, if you take a look at the screenshot below, you can see that the website scored a performance grade of D. The load time is also not optimal and can be improved.
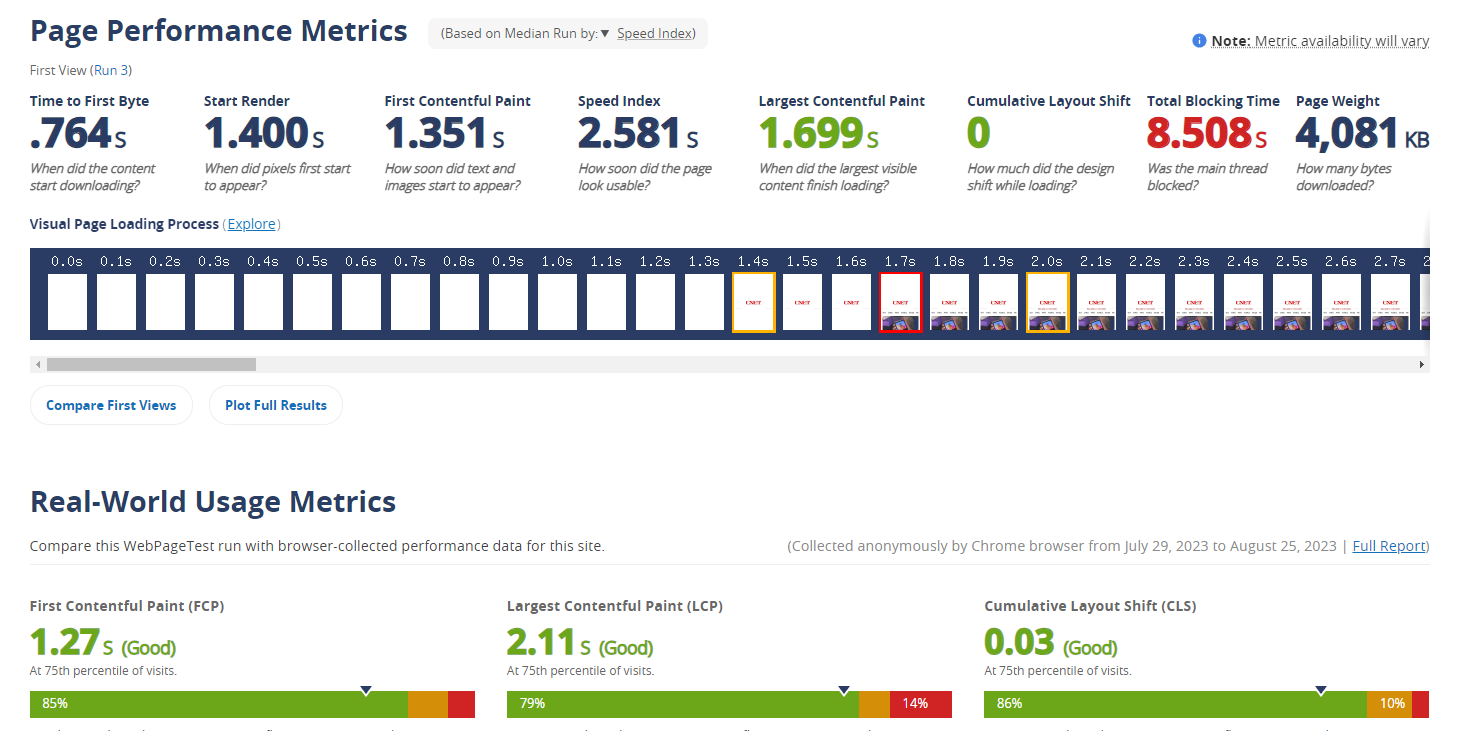
4. WebPageTest
WebPageTest is a free tool that can help website owners and developers enhance their site’s speed and performance. It thoroughly examines loading times, rendering speed, and network consumption. You’ll receive a detailed breakdown of each page component, helping you find slowdowns and opportunities for enhancement.
It’s particularly beneficial to evaluate the efficiency of browser caching. Additionally, you can access vital metrics such as TTFB, keep-alive, compression, browser caching, and CDN performance.
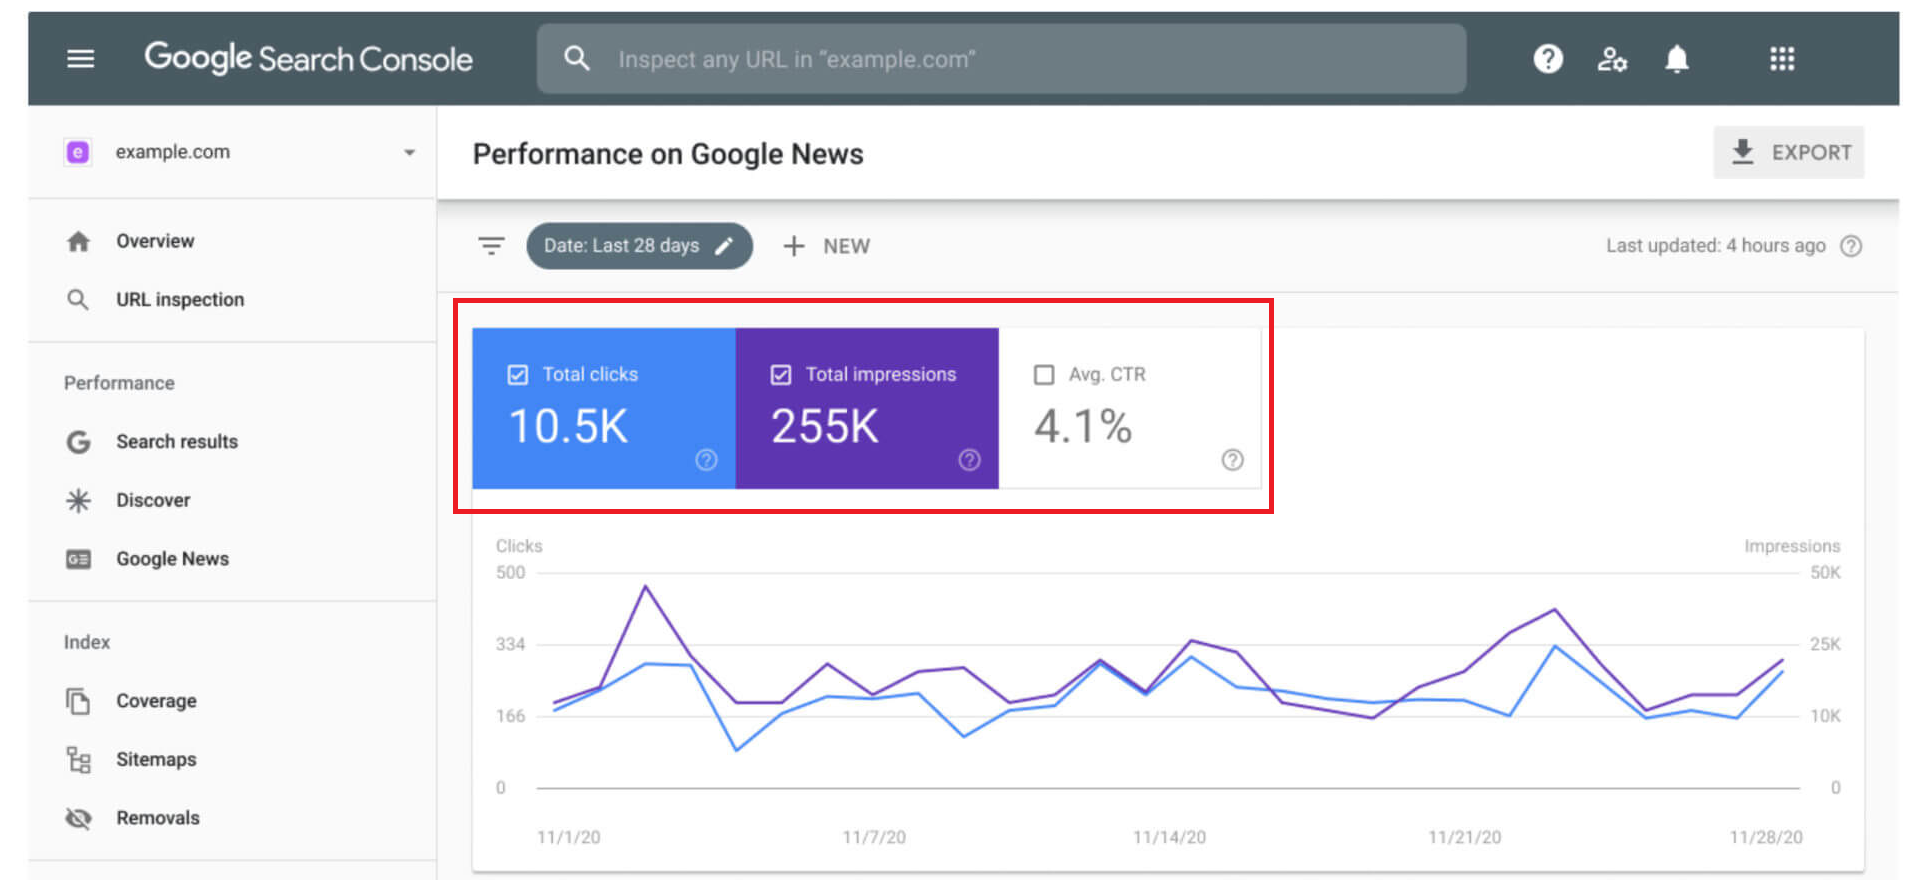
3. Troubleshoot Website Errors
To learn about any issues on your WP site, you need Google Search Console.
The Google Search Console is a free tool enabling users to examine how well their website performs in search results and whether any problems could impact its performance.
It does this by gathering data over an extended period, giving you important information about your site’s performance. It also points out the user experience and technical problems.
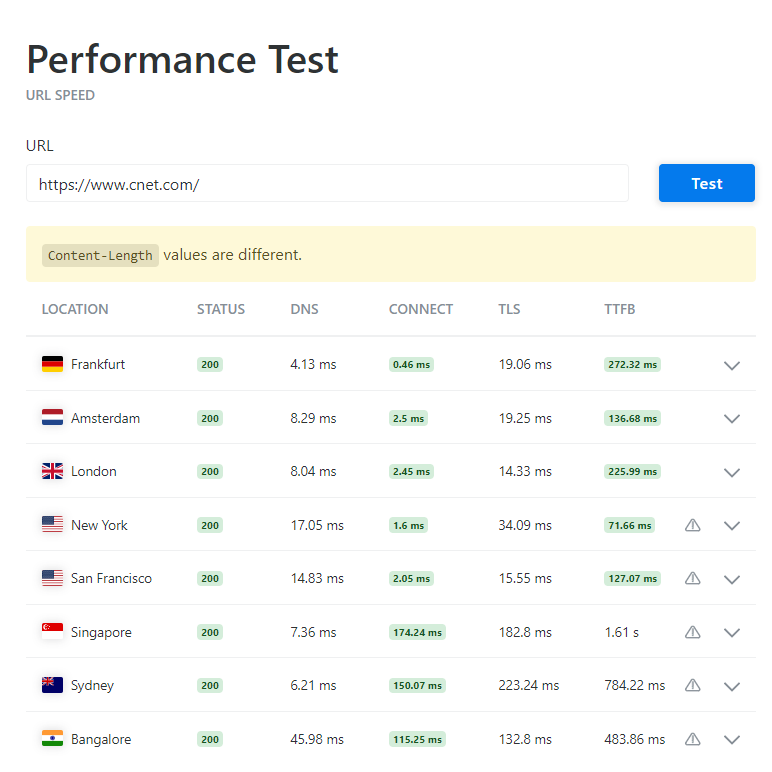
4. Test Global Performance
If you’ve created a WordPress site that serves a global audience, you must ensure that your website works fine in all regions. This is where you’ll require the help of the KeyCDN Performance Test.
KeyCDN
KeyCDN allows you to assess a single website using 14 different global locations. You can keep your test results private or share them publicly. The outcomes provide information about requests, content size, and loading times.
5. Monitor Server Downtime
You should consider using the free Uptime Robot tool to audit your WordPress site for downtimes.
Uptime Robot
This tool runs tests on your site every 30 seconds, promptly sending notifications in case of downtime.
What sets Uptime Robot apart is its exceptional compatibility with both Android and iOS platforms. This feature lets you stay informed about any issues with your site on the go, making it a convenient and invaluable resource for proactive website management.
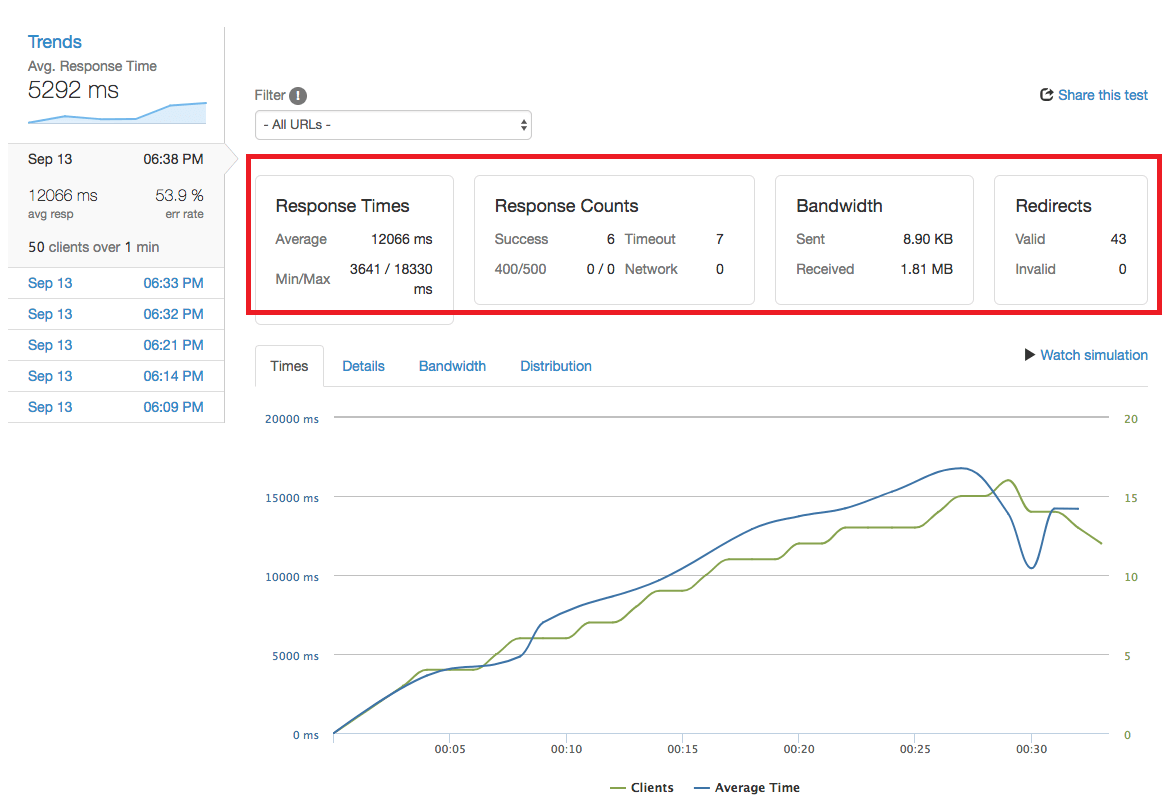
6. Perform Load Testing
You should always conduct a load test on your site to check its response time. Instead of randomly guessing how much traffic your site can take, you must know for sure before it’s too late.
But how can you do that? By using Loader.io!
Loader.io
Loader.io is a free tool for stress-testing websites, apps, and APIs.
Regular testing is important for dynamic sites like WordPress to gauge performance under various server load situations, such as high visitor traffic or potential bot attacks.
You have three test options:
- Clients per test: Even distribution of clients during the test
- Clients per second: Number of client requests per second
- Maintain client load: Constant client count throughout the test
Simplify Multisite Management With Cloudways!
Streamline your online presence with Cloudways. Effortlessly handle multiple sites using our top-tier WordPress multisite hosting.
Front-End Website Performance Audit (Manually)
For the manual WordPress site audit, here is where you should start:
- Launch Google Chrome in incognito mode to prevent any browsing data from affecting the outcomes.
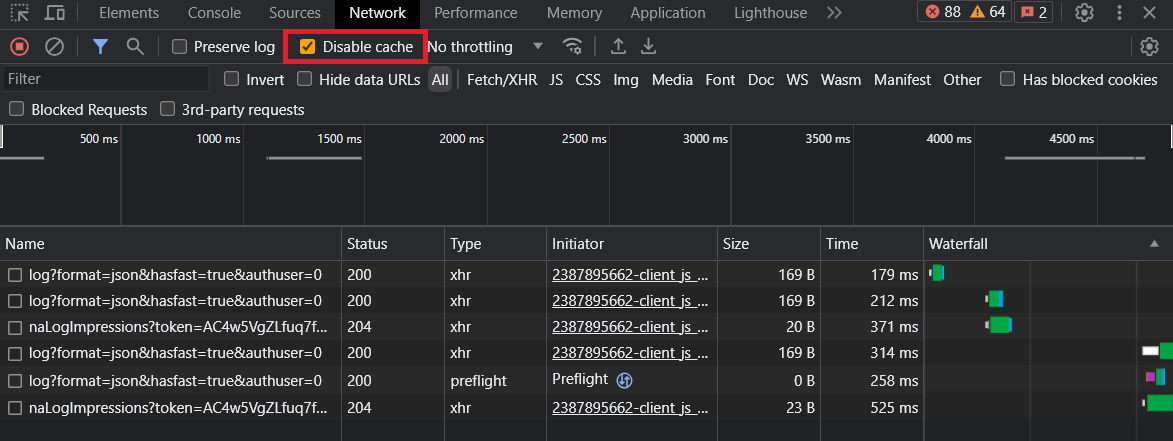
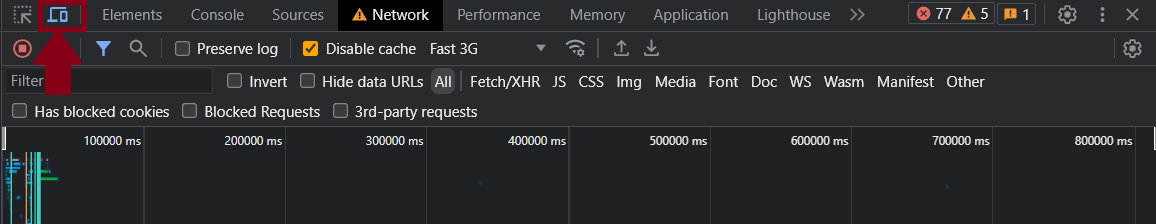
- Utilize the F12 key to initiate Chrome DevTools and access the Network tab.
- Temporarily enable the Disable Cache option to prevent the browser from storing client-side cache.
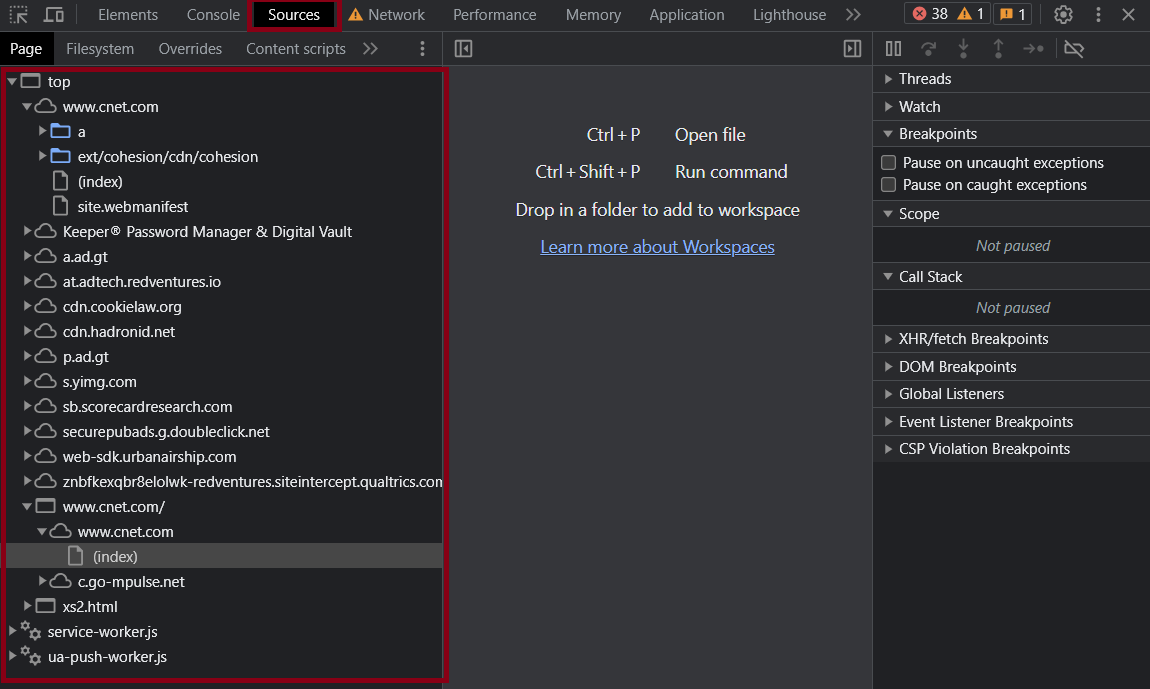
- Examine various subpages to the desired website’s main page. I’ll consider CNET.com as an example here.
- To compensate for fluctuations in results, you should perform several test runs and only use the results that do not show any obvious deviations.
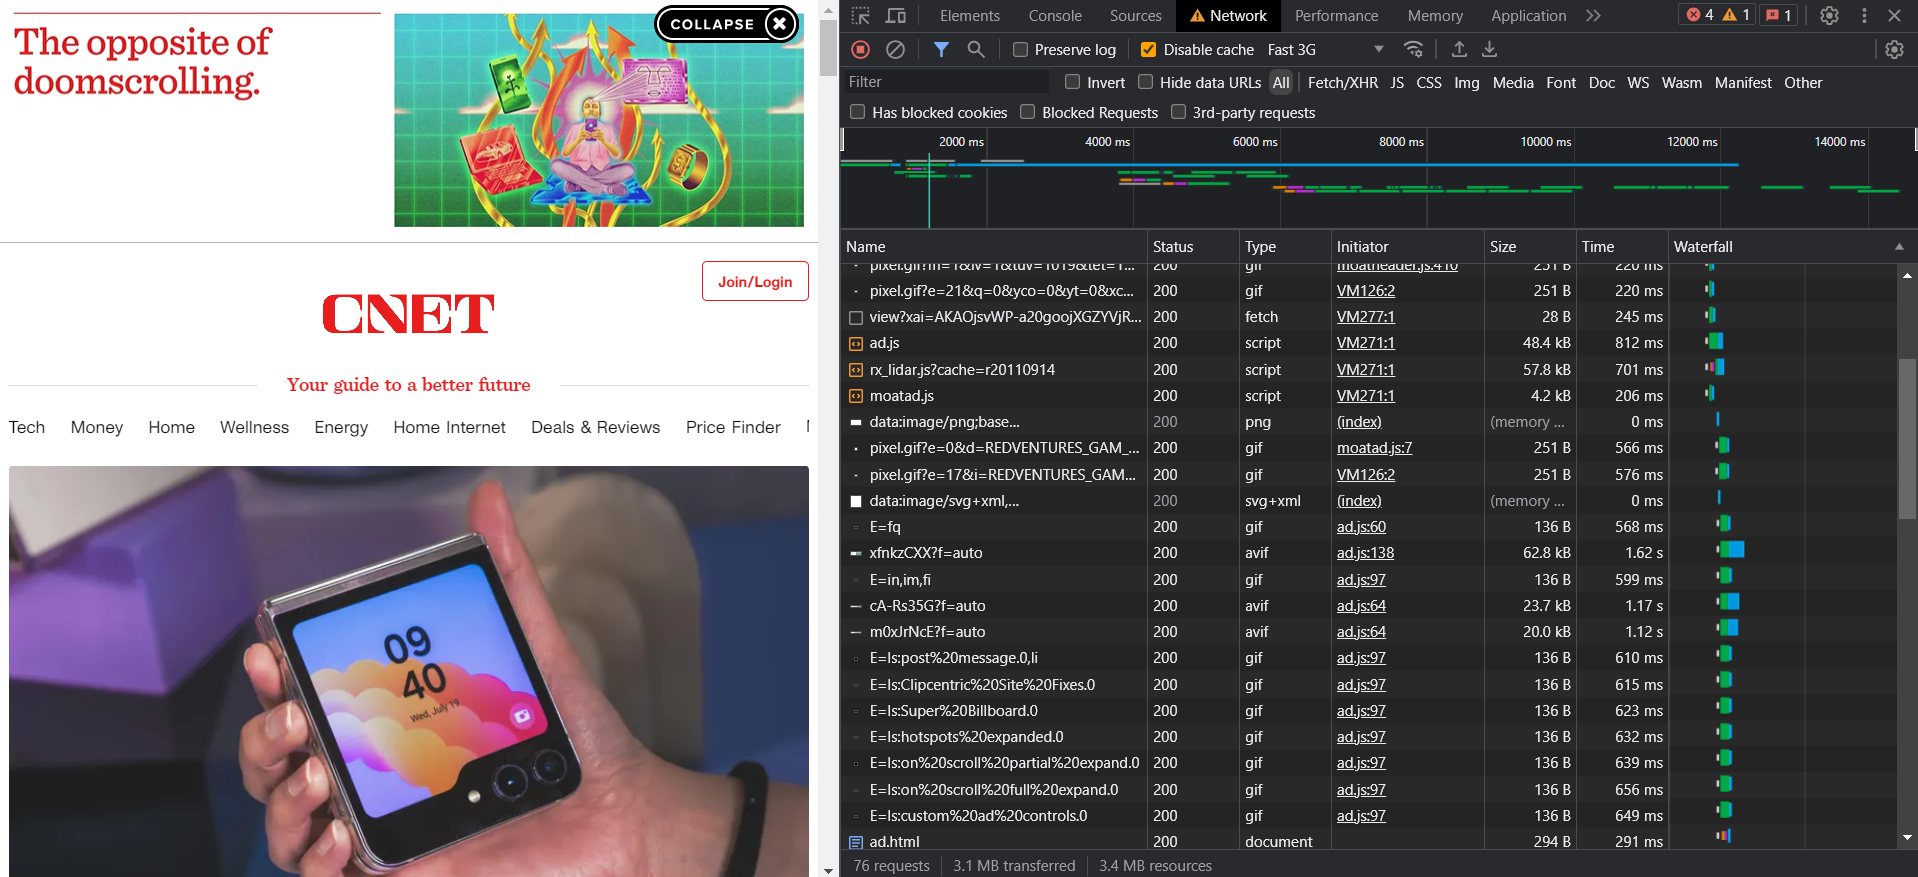
Okay, so what exactly are you supposed to look for when conducting a manual WordPress site audit?
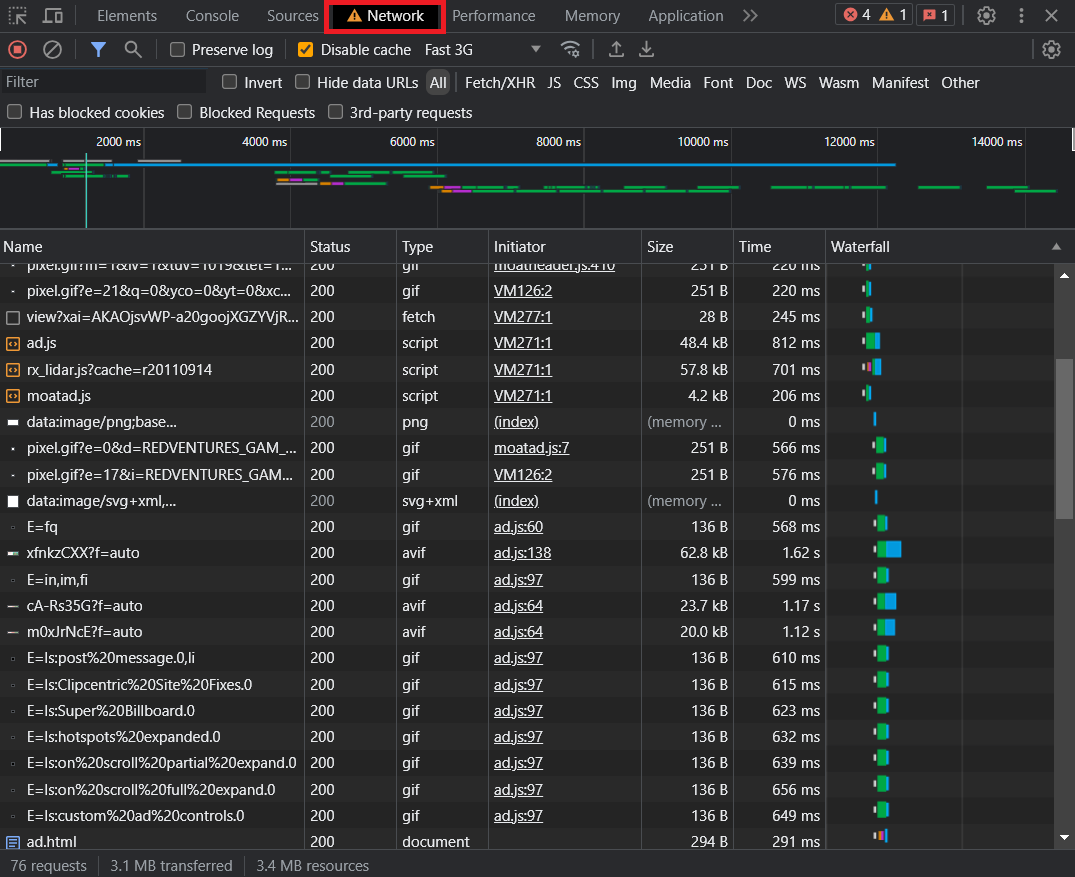
Well, the Waterfall Graph and footer of the Network tab. This tab displays important measurements for network analysis.
Take a look at the screenshot below:
At the very bottom, you’ll see the following:
- Requests
- MB transferred
- MB resources
- Finish
- DOMContentLoaded
- Load
And next to the Time column, you’ll see the waterfall graph. The waterfall graph shows how long it takes for each thing to load on a website and how things are requested simultaneously.
This graph helps you determine if slowness is because there are lots of things to load or if there are delays in how things work. The time it takes to get the first piece of data (TTFB) is really important in this case.
Now that you know what to look for, let’s see how you can interpret the results.
Requests:
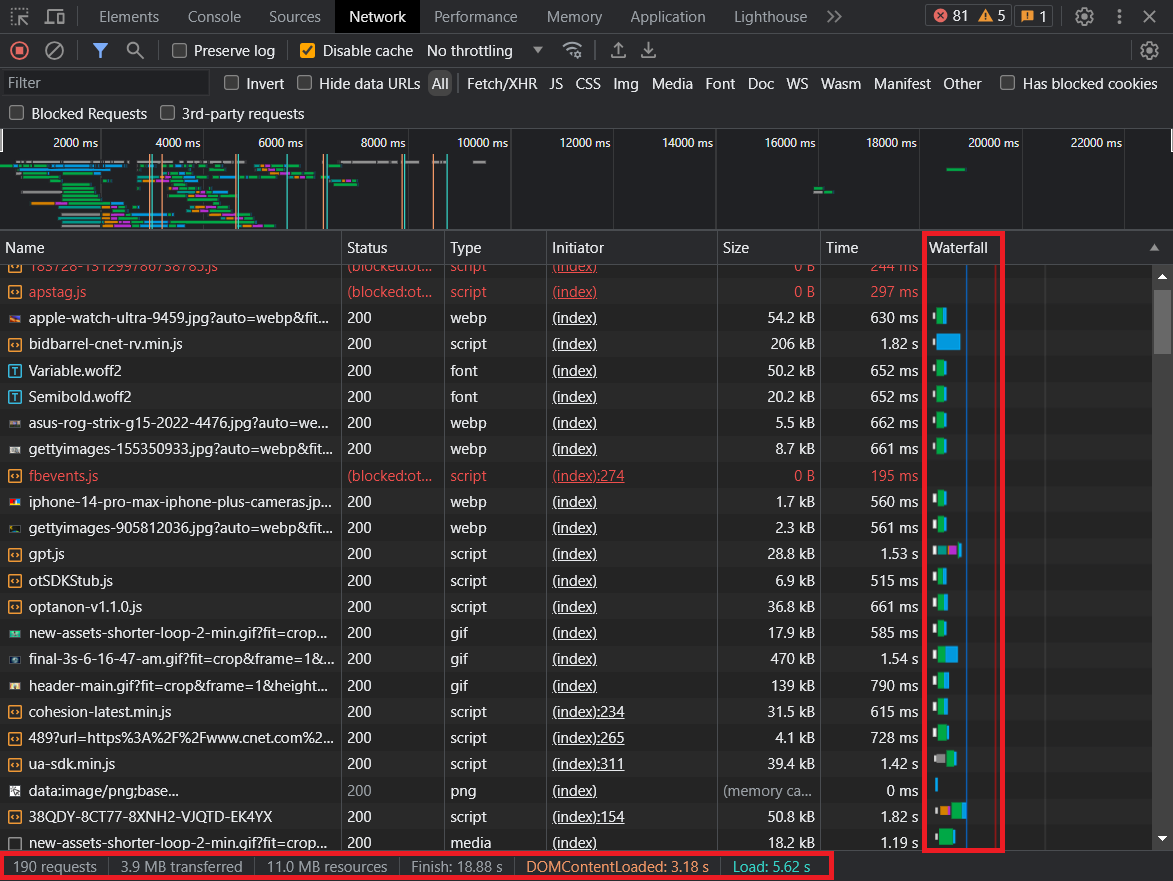
If you take a look at the screenshot, you’ll see that on the homepage of cnet.com, you’ll see that 190 requests were made while loading the page.
![]()
These requests include all files, images, scripts, and other resources the page requests.
What to do to fix this?
Decrease the number of requests sent over the network by combining resources, eliminating unneeded requests, and using lazy loading for images and videos when suitable.
MB transferred:
Moving forward, we examine the total data volume in megabytes that was transmitted over the network to load the webpage and its associated elements.
If the total was 3.8 MB, this measurement considers any resource compression, such as Gzip or Brotli, that was applied during the transfer.
![]()
What to do to fix this?
Decrease the data volume by compressing resources, optimizing images and videos, and implementing Gzip compression when suitable.
MB Resources:
This value indicates the combined resource size during page load, excluding headers and cookies. In my case, it represents the actual resource size after client decompression, totaling 11.0 MB.
![]()
What to do to fix this?
Reduce resource size by eliminating unused scripts and stylesheets, optimizing code, and compressing resources.
Finish:
It is the time needed to finish all network requests and fully download resources. It is measured in seconds. It concludes when the last resource is received.
In our case, this time is 18.88 seconds. It’s important to note that if resources are downloaded asynchronously, like during video playback, the finish time continues even after the complete webpage load.
![]()
What to do to fix this?
Speed up load times by improving resource efficiency, upgrading to faster hosting, or adopting CDN solutions.
DOMContentLoaded:
DOMContentLoaded is the duration it takes for the page’s Document Object Model (DOM) to be constructed and prepared for scripting. This time, measured in seconds, concludes when the browser window triggers the DOMContentLoaded event. In our, the DOMContentLoaded time we got was 3.18 s.
![]()
What to do to fix this?
Enhance DOM readiness by prioritizing essential resources, preventing render-blocking resources, and loading scripts asynchronously.
Load:
Load time represents the duration for the complete page to load, encompassing all resources, images, and scripts. This time, measured in seconds, concludes when the browser window triggers the load event, indicating the processing of all resources and scripts and the full page load. The time it took to load the entire page in our test was 5.62 seconds.
![]()
What to do to fix this?
Decrease the total load time by applying the mentioned optimization techniques and consistently overseeing and refining your website’s performance.
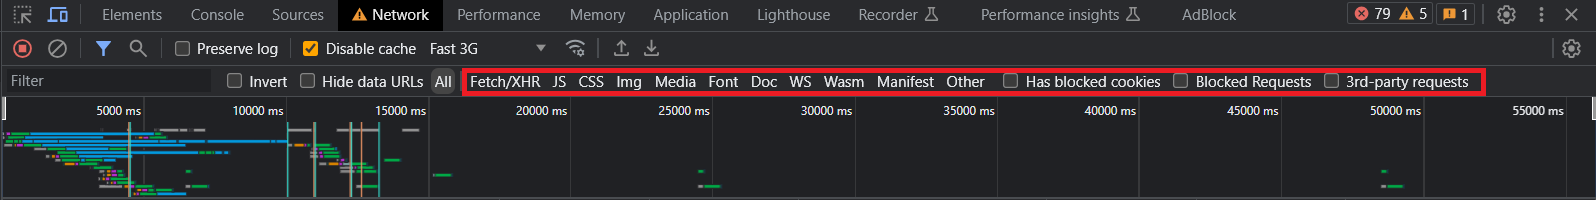
1. Use Filters to Streamline Performance Analysis
Within the Network tab, employing filters streamlines analysis and enables focused examination of particular resource types. The available categories are:
- Fetch/XHR
- JS
- CSS
- Img
- Media
- Font
- Doc
- WS
- Wasm
- Manifest
- Other
2. Leverage Chrome DevTools’ Throttling Feature
The throttling tool in Chrome DevTools lets you pretend to have slower internet and weaker computers like some users. It helps you see how your website loads for people with various internet speeds and less powerful devices, not just fast computers and good connections.
3. Conduct Responsive Testing
With the Device Toolbar in Chrome DevTools, you can replicate how your site looks on various devices. This is helpful for identifying and addressing performance or display issues on mobiles and tablets.
During the simulation, you can alter the device’s orientation (portrait or landscape), modify zoom, and even apply network and CPU restrictions for more authentic testing scenarios.
4. Optimize Media Content for Website Performance
Optimizing media content like images and videos on a website is crucial for performance. These resources can slow down loading times, with videos usually loading asynchronously and images loading fully on page load.
To enhance image loading, consider lazy loading. Compressing and using the right image format and adjusting sizes for different devices are important.
Image compression is key, too, reducing file sizes while maintaining quality. In platforms like WordPress, plugins and services can help with optimization
5. Pay Attention to Resource Management
For optimal performance on a WordPress site without third-party embeddings, a caching plugin like Breeze by Cloudways can work well. However, achieving high performance becomes more challenging when external third-party resources are embedded.
These resources are loaded from external servers, limiting direct optimization options. Such integrations include YouTube videos, scripts, stylesheets, fonts, images, videos, social media widgets, analytics tools, and more.
Aim to reduce the number of third-party resources on your site. Remove any that are redundant or not adding significant value. Consolidate resources where possible.
Let Cloudways Help You Unleash “Performance” for Your Clients!
Empower your development projects and agency ventures with Cloudways. Experience unparalleled WordPress hosting for unmatched performance delivery.
Back-End WordPress Performance Audit
Having completed the frontend WordPress performance audit, let’s shift our focus to enhancing your site’s performance from a backend perspective.
1. Updates and Maintenance
- Plugin Management: Regularly remove unnecessary plugins and keep WordPress and active plugins up to date to prevent security vulnerabilities and performance issues.
- PHP Version: Ensure your server runs the latest PHP version to leverage performance improvements and security updates. This is considered an important part of a WordPress performance & security site audit.
2. Database Optimization
- Optimize Database: Over time, remove outdated data and clutter from your database, enhancing efficiency.
- Plugin Assistance: Use plugins to automate database cleanup and reduction, optimizing system performance.
3. Schedule Cron Jobs
- Cron Jobs: Automate recurring tasks with WordPress’s built-in WP-Cron system.
- Performance Concerns: WP-Cron’s frequent triggers during page loads can lead to performance problems, especially with high-traffic or resource-intensive tasks.
- True Cron Jobs: Improve performance and reliability by replacing WP-Cron with true system-controlled cron jobs. Disable WP-Cron and set up system-driven cron jobs through your web host’s control panel.
4. Server-Side Caching
- Caching Solutions: Utilize server-side caching tools like LiteSpeed, Varnish, and Redis for improved performance.
- Efficiency Advantage: Server-side caching stores frequently requested data closer to the server source, resulting in quicker and more efficient content delivery than application-level caching plugins.
- Server Load and Scalability: Reduced server load and better scalability for high traffic due to optimized caching solutions.
- Handling Dynamic Content: Server-side caching efficiently manages dynamic content, which is beneficial for complex WordPress websites.
Summary
So, to wrap things up, a slow-loading website can lead to decreased visitors and revenue. However, a comprehensive WordPress performance audit can swiftly pinpoint issues and guide you in resolving them.
This audit encompasses two key aspects: the front-end website performance and back-end audits. The front-end audit can be conducted either synthetically through automated tools or manually through personal review.
Your approach depends on your preferences and requirements for optimizing your website’s performance.
Q1. How to measure the performance of WordPress?
A. Use tools like GTmetrix, Google PageSpeed Insights, and WebPageTest to analyze loading times, optimize images, and identify performance bottlenecks.
Q2. What are some important factors to consider during a WordPress audit?
A. Focus on speed optimization (caching, image compression), security (updates, plugins), responsive design, SEO practices, and efficient code.
Q3. What is included in a performance audit?
A. A performance audit analyzes loading speed, mobile optimization, server response times, browser caching, image optimization, code quality, and security measures.
Abdul Rehman
Abdul is a tech-savvy, coffee-fueled, and creatively driven marketer who loves keeping up with the latest software updates and tech gadgets. He’s also a skilled technical writer who can explain complex concepts simply for a broad audience. Abdul enjoys sharing his knowledge of the Cloud industry through user manuals, documentation, and blog posts.